Titration of acids and bases
Acids and bases
What is it all about?
Titration is originally a technique for determination of the concentration of a specific component, i.e. what is called a quantitative analysis. Most people who have tried titration at school, associate titration with acids and bases, where the concentration of acid is determined by adding a known amount of base until the equivalence point has been reached, or vice versa. It does not have to be acids and bases, there is also redox titrations, where you are measuring on other molecules. This will be addressed under redox reactions. Titrations can also be used for qualitative analysis, i.e. identification of the molecule, for weak and medium strength acids and bases. The qualitative analysis only works if you can see all the pKa or pKb values on the titration curve, so there is a limit to the usability for qualitative analysis.
Titration curves
The easiest way to understand titrations, is by looking at some titration curves.
Starting with something simple, a strong monovalent acid, e.g. 5 ml HCl (1 M solution), which we titrate with a strong base, e.g. NaOH (1 M solution), so the general titration curve looks like this:

As it shows, the titration curve is not linear. Titration curves are not linear. The point where the curve is almost vertical, you have the equivalence point. Here the number of moles acid is equivalent to the number of moles base, i.e. n(acid)=n(base), which we use in the stoichiometric calculation (addressed in the next section). Had it been the other way around, i.e. 1 M NaOH titrated with 1 M HCl, we would have had a similar curve, only it would have started at pH 14 and ended at pH 0.5.
An important detail: Titration is normally done using strong acids or bases! It is a entirely practical thing. If you titrate weak or medium strength acids/bases with a weak or medium strength counterpart, you have to deal with two equilibria affecting each other, and the equivalence points becomes hard or impossible to see. In principle you can do it, and neutralizing by using weak or medium strength acids or bases do have practical applications, e.g. removing lime scale using vinegar or citric acid. For titrations for quantitative and qualitative analysis, where accuracy is essential, you need to use strong acids and bases.
If we have to titrate a medium strength or weak acid (or base), things becomes a bit more complicated. Since they do no fully dissociate, you have at the start a weak/medium strength acid in equilibrium with itself, but as soon as you start titrating, you have an equilibrium of an acid and its corresponding base, i.e. a buffer. Equilibria are temperature dependent, so you can also expect the titration curves to be temperature dependent! For titration of 5 ml acetic acid (1 M solution) with NaOH (1 M solution) at room temperature, it looks like this:

Because it is a buffer, we find an important point halfway through the titration (marked by the red arrow). This is where the concentration of acid is equal to the concentration of base, i.e. pH = pKa. This means that if you make a titration curve for an unknown acid, you can determine pKa and thus identify the acid. The method has an inherent uncertainty, as you are reading a graph, so in practice it is highly likely that additional tests are necessary for identification. If it is a polyvalent acid (or base) the following pKa values are in the mid between the equivalence points (demonstrated a bit further down).
Right in the equivalence point, you have a weak/medium strength base, depending on what the corresponding base was. In this case, it is the acetate ion, having pKb = 9.25, and we have doubled the volume by the titration, so the formal concentration is 0.5 M. After the equivalence point, you have a weak base plus a strong base, where the strong base quickly becomes the dominant, and you start calculating on the solution as a strong base.
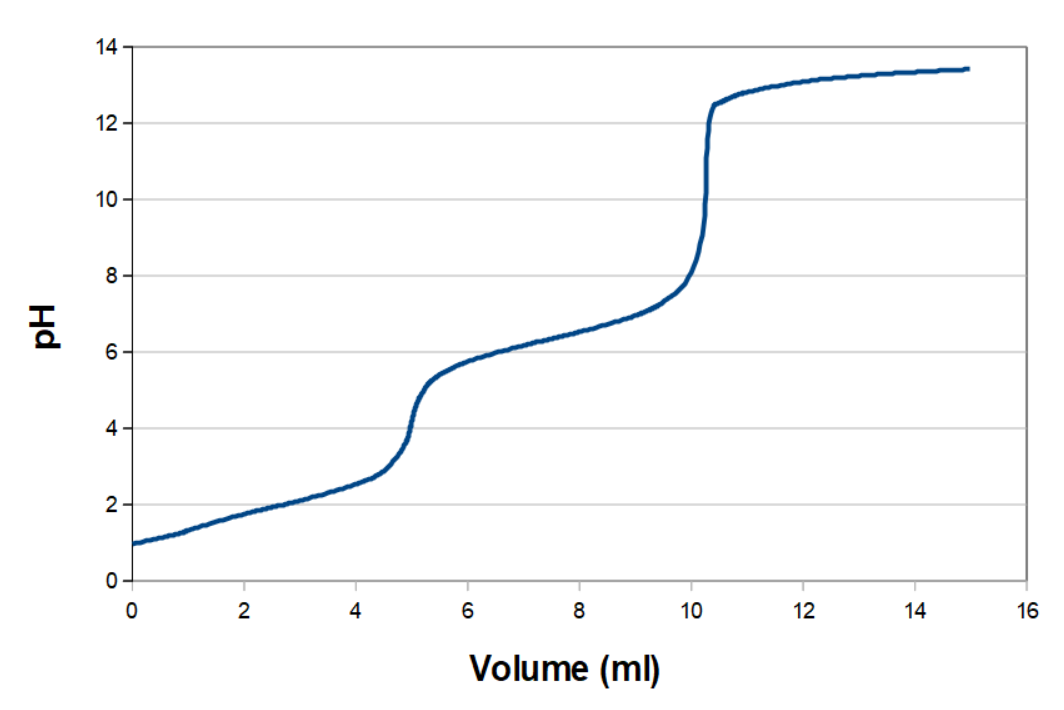
If you are titrating a divalent acid, you will, in theory, get a titration curve like the monovalent acids, only with two equivalence points. In practice it is only some of the divalent acids, where you can see the change as an abrupt increase in pH. It works with an acid like maleic acid (ethane dicarboxylic acid), where pKa1 and pKa2 are 1.91 and 6.33, respectively, at room temperature. That titration curve looks something like this:

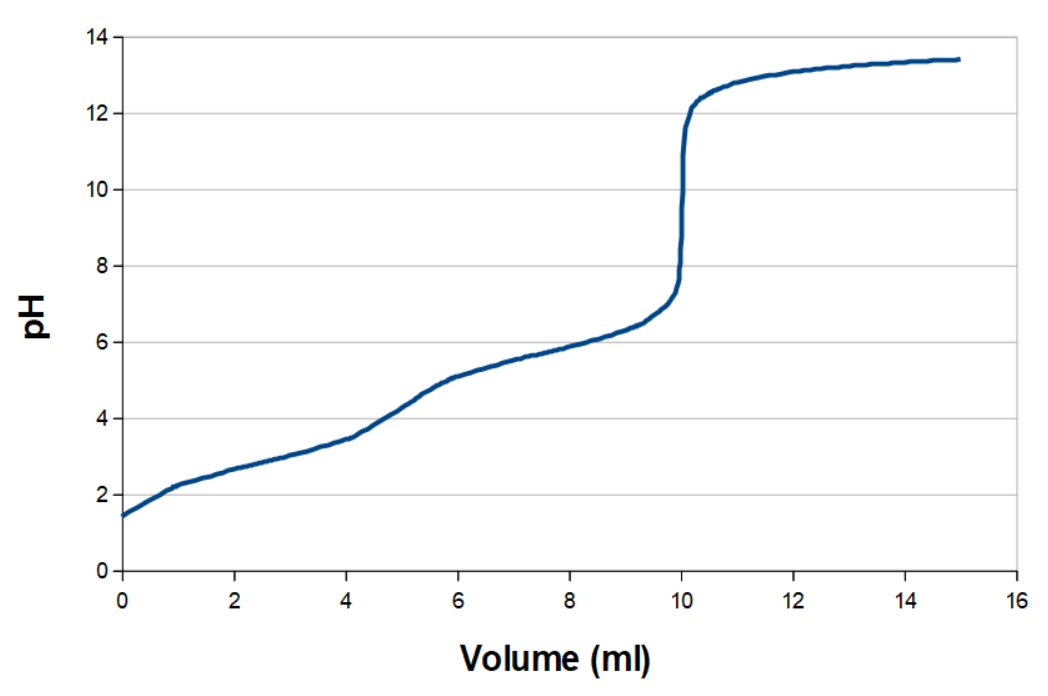
If the two pKa values are close, it can be hard or impossible to see the pKa values. Malonic acid (propane dicarboxylic acid), where pKa1 and pKa2 are 2.83 and 5.69, respectively, has a titration curve that looks something like this at room temperature:

The first equivalence point and pKa1 is not as easy to see as it was with the malei acid. Since the second equivalence point is easy to see, you can calculate where the first equivalence point must be, as this is at half the titration volume for the second equivalence point. You also know that pKa1 and pKa2 are found right at middle between start and the first equivalence and at the middle between the two equivalence points, respectively. It is thus possible to reason your way to the informations that are not easily discernible on the titration curve, but this is deduction of where the pKa values must be, not a reading.
Starting with something simple, a strong monovalent acid, e.g. 5 ml HCl (1 M solution), which we titrate with a strong base, e.g. NaOH (1 M solution), so the general titration curve looks like this:

As it shows, the titration curve is not linear. Titration curves are not linear. The point where the curve is almost vertical, you have the equivalence point. Here the number of moles acid is equivalent to the number of moles base, i.e. n(acid)=n(base), which we use in the stoichiometric calculation (addressed in the next section). Had it been the other way around, i.e. 1 M NaOH titrated with 1 M HCl, we would have had a similar curve, only it would have started at pH 14 and ended at pH 0.5.
An important detail: Titration is normally done using strong acids or bases! It is a entirely practical thing. If you titrate weak or medium strength acids/bases with a weak or medium strength counterpart, you have to deal with two equilibria affecting each other, and the equivalence points becomes hard or impossible to see. In principle you can do it, and neutralizing by using weak or medium strength acids or bases do have practical applications, e.g. removing lime scale using vinegar or citric acid. For titrations for quantitative and qualitative analysis, where accuracy is essential, you need to use strong acids and bases.
If we have to titrate a medium strength or weak acid (or base), things becomes a bit more complicated. Since they do no fully dissociate, you have at the start a weak/medium strength acid in equilibrium with itself, but as soon as you start titrating, you have an equilibrium of an acid and its corresponding base, i.e. a buffer. Equilibria are temperature dependent, so you can also expect the titration curves to be temperature dependent! For titration of 5 ml acetic acid (1 M solution) with NaOH (1 M solution) at room temperature, it looks like this:

Because it is a buffer, we find an important point halfway through the titration (marked by the red arrow). This is where the concentration of acid is equal to the concentration of base, i.e. pH = pKa. This means that if you make a titration curve for an unknown acid, you can determine pKa and thus identify the acid. The method has an inherent uncertainty, as you are reading a graph, so in practice it is highly likely that additional tests are necessary for identification. If it is a polyvalent acid (or base) the following pKa values are in the mid between the equivalence points (demonstrated a bit further down).
Right in the equivalence point, you have a weak/medium strength base, depending on what the corresponding base was. In this case, it is the acetate ion, having pKb = 9.25, and we have doubled the volume by the titration, so the formal concentration is 0.5 M. After the equivalence point, you have a weak base plus a strong base, where the strong base quickly becomes the dominant, and you start calculating on the solution as a strong base.
If you are titrating a divalent acid, you will, in theory, get a titration curve like the monovalent acids, only with two equivalence points. In practice it is only some of the divalent acids, where you can see the change as an abrupt increase in pH. It works with an acid like maleic acid (ethane dicarboxylic acid), where pKa1 and pKa2 are 1.91 and 6.33, respectively, at room temperature. That titration curve looks something like this:

If the two pKa values are close, it can be hard or impossible to see the pKa values. Malonic acid (propane dicarboxylic acid), where pKa1 and pKa2 are 2.83 and 5.69, respectively, has a titration curve that looks something like this at room temperature:

The first equivalence point and pKa1 is not as easy to see as it was with the malei acid. Since the second equivalence point is easy to see, you can calculate where the first equivalence point must be, as this is at half the titration volume for the second equivalence point. You also know that pKa1 and pKa2 are found right at middle between start and the first equivalence and at the middle between the two equivalence points, respectively. It is thus possible to reason your way to the informations that are not easily discernible on the titration curve, but this is deduction of where the pKa values must be, not a reading.
Determination of concentration by titration
One of the stoichiometric calculations for which you can use titrations, is determination of concentrations of acids and bases in solutions. This could be for quality assurance for products, where you want to test whether the acid or base content is within specifications, or e.g. surveilance of the acid emissions from exhaust scrubbers on large ships.
The way to approach this is by taking a known amount of the solution, e.g. 100 ml apple cider vinegar, which, according to the declaration, contains 5 % acid. The acid in apple cider vinegar is acetic acid.
By titration using a 1.0 M NaOH solution, the equivalence point is at 83.2 ml, equivalent to 83.2 · 10−3 mol OH-. So, if we start by writing the number of moles:
From the reaction equation we can see that n(HAc) = n(OH-) = 83.2 · 10−3 mol, i.e.:
The molecular weight for acetic acid is 60.05 g/mol, so m(HAc) = n(HAc) · M(HAc) = 5.0 g. This is in 100 ml apple cider vinegar with a density of 1.0 i.e. 100 g apple cider vinegar, so the acetic acid content is 5 % (by vægt), as it is supposed to be, according to the declaration.
The way to approach this is by taking a known amount of the solution, e.g. 100 ml apple cider vinegar, which, according to the declaration, contains 5 % acid. The acid in apple cider vinegar is acetic acid.
By titration using a 1.0 M NaOH solution, the equivalence point is at 83.2 ml, equivalent to 83.2 · 10−3 mol OH-. So, if we start by writing the number of moles:
| HAc(aq) | + OH−(aq) |  | H2O(l) | + Ac−(aq) | |
| Start | ? | ||||
| Added | 83.2 · 10−3 mol | ||||
| End | 0.0 mol | 83.2 · 10−3 mol | 83.2 · 10−3 mol |
From the reaction equation we can see that n(HAc) = n(OH-) = 83.2 · 10−3 mol, i.e.:
| HAc(aq) | + OH−(aq) |  | H2O(l) | + Ac−(aq) | |
| Start | 83.2 · 10−3 mol | ||||
| Added | 83.2 · 10−3 mol | ||||
| End | 0.0 mol | 83.2 · 10−3 mol | 83.2 · 10−3 mol |
The molecular weight for acetic acid is 60.05 g/mol, so m(HAc) = n(HAc) · M(HAc) = 5.0 g. This is in 100 ml apple cider vinegar with a density of 1.0 i.e. 100 g apple cider vinegar, so the acetic acid content is 5 % (by vægt), as it is supposed to be, according to the declaration.
Back titration
There may be situations where you cannot do a titration directly on the acid/base you want to analyse.
It could be because you have to do an indirect measurement, e.g. the formation of acid from a reaction, which you transfer to a known amount of base, and titrate the excess base to calculate how much acid was formed during the reaction. The Kjeldahl analysis is such an analysis, except here a base is formed (NH3) and led over into an acid (HCl).
It may also be because the acid or base is insoluble in water and needs to be converted to a soluble form. Titration of benzene di-carboxylic acid shown in the last section is an example of this.
Bjerrum diagrams
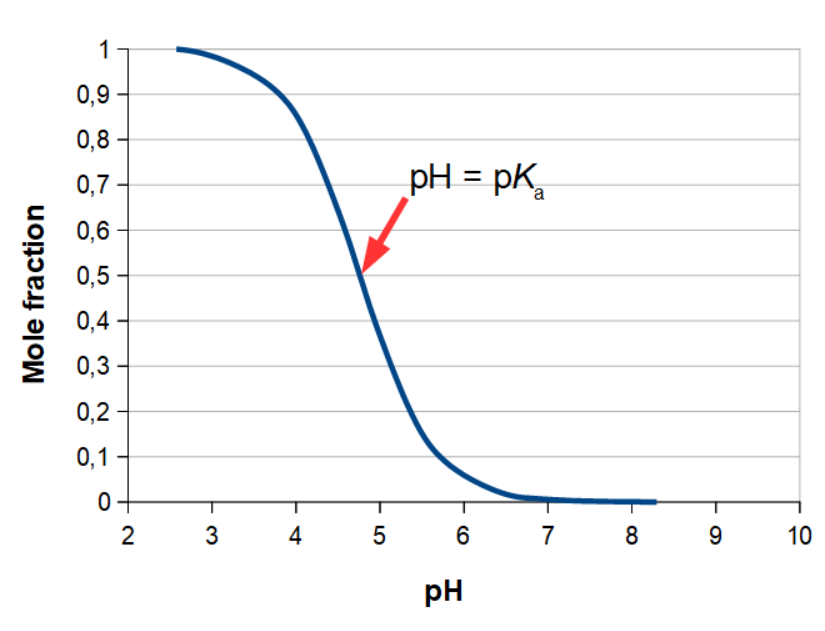
An alternative way of showing titration curves is using a Bjerrum diagram (named after the Danish chemist Niels Bjerrum). The method only works for weak and medium strength acids and bases, where the titration provides an equilibrium between an acid and its corresponding base. Where the ordinary titration curve shows pH and titrant volume, the Bjerrum diagram displays the mole fraction as a function of pH. For acetic acid, the Bjerrum diagram looks like this:

As it is a buffer you are working with, until the equivalence point, you also know that at the mole fraction 0.5, X(acetic acid) = 0.5 in the example, you have pH = pKa. If you have divalent or trivalent acids or bases, you will in the Bjerrum diagram, insert the 2 or 3 curves, respectively, that goes with the second and third equivalence points. The method is mainly used for educational purposes in chemistry, as it is very illustrative in regards to experimental determination of pKa for a specific acid, or pKb for a specific base. For ordinary lab work, Bjerrum diagrams are rarely used.

As it is a buffer you are working with, until the equivalence point, you also know that at the mole fraction 0.5, X(acetic acid) = 0.5 in the example, you have pH = pKa. If you have divalent or trivalent acids or bases, you will in the Bjerrum diagram, insert the 2 or 3 curves, respectively, that goes with the second and third equivalence points. The method is mainly used for educational purposes in chemistry, as it is very illustrative in regards to experimental determination of pKa for a specific acid, or pKb for a specific base. For ordinary lab work, Bjerrum diagrams are rarely used.
The difference between theory and practice, and how wrong things can go
As shown with the maleic acid above, you can, by making a titration curve, identify an acid or a base by reading the pKa value, or values if the acid/base is polyvalent. But in order to titrate, the acid/base must be dissolved in water, so what do you do, if the solubility of the acid/base in water is low? Here you use an artifice in the form of back titration, where you add an excess amount of base and titrate the solution with a strong acid.
The acid benzene dicarboxylic acid is found as three isomers, where the two carboxylic acids are placed in ortho, meta or para positions. These are named phthalic acid, isophthalic acid and therephthalic acid. For all three isomers, the solubility in water is low, but in order to titrate the acid groups, the acids must be dissolved in water.
What you do is over titrate the dicarboxylic acid with a strong base, so the molecules will go from its acid form with two COOH groups to the alkaline form having two COO− groups. We now have all the dicarboxylic acid in the water soluble form as the corresponding base, plus some OH− from the excess strong base. This we titrate back using a strong acid, e.g. HCl.
So far theory and practice are in compliance.
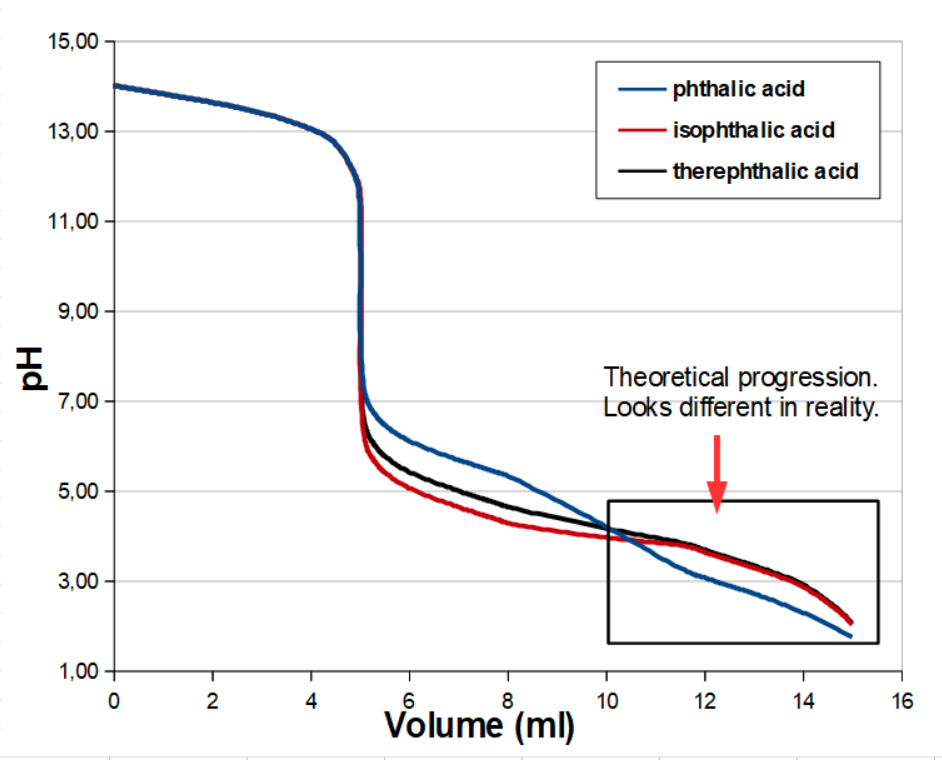
For the model below, the concentrations of OH− and the dicarboxylic acid are bothe set to 1.0 M, and we titrate using a 1.0 M strong acid. Then the three titration curves for the back titrations should look someting like this, in theory:

In reality the titration curves do not look exactly like this. Until the second equivalence point at 10 ml, where the three dicarboxylic acids will be ampholytes, the curves will be more or less correct. After this, the insolubility of the acid form will start affecting the result.
The solubility of the three acids in acid form is far below the theoretical final concentration 0.25 M. The low final pH values shown are thus not possible in reality. Phthalic acid, which is the most soluble of the acids, can get as low as around pH 2.1 for a saturated solution. What happens is that normally, when titrating in the buffer range as shown here, the concentration of the acid increases while the concentration of the corresponding base decreases. This is what we under normal circumstances uses in the buffer equation:
where c(acid) = [acid] + [base].
But, since the solubility of the acid form is as low as it is, we soon reach the maximum concentration for the acid in the the buffer equation, after which the acid precipitates when formed and the concentrations of acid and base are no longer inversely proportional. The actual acid concentration, [acid], becomes a constant and the actual concentration of base, [base], decreases proportionally. The precipitation can be seen by the solution becoming milky and unclear. If the amount of insoluble acid is sufficiently high, you end up with a completely while slurry.
THEREFORE: For titrations be aware of secondary reactions, e.g. precipitations, phase separations, degassing and complex formations, that might affect the titration/titration curve!
The acid benzene dicarboxylic acid is found as three isomers, where the two carboxylic acids are placed in ortho, meta or para positions. These are named phthalic acid, isophthalic acid and therephthalic acid. For all three isomers, the solubility in water is low, but in order to titrate the acid groups, the acids must be dissolved in water.
What you do is over titrate the dicarboxylic acid with a strong base, so the molecules will go from its acid form with two COOH groups to the alkaline form having two COO− groups. We now have all the dicarboxylic acid in the water soluble form as the corresponding base, plus some OH− from the excess strong base. This we titrate back using a strong acid, e.g. HCl.
So far theory and practice are in compliance.
For the model below, the concentrations of OH− and the dicarboxylic acid are bothe set to 1.0 M, and we titrate using a 1.0 M strong acid. Then the three titration curves for the back titrations should look someting like this, in theory:

In reality the titration curves do not look exactly like this. Until the second equivalence point at 10 ml, where the three dicarboxylic acids will be ampholytes, the curves will be more or less correct. After this, the insolubility of the acid form will start affecting the result.
The solubility of the three acids in acid form is far below the theoretical final concentration 0.25 M. The low final pH values shown are thus not possible in reality. Phthalic acid, which is the most soluble of the acids, can get as low as around pH 2.1 for a saturated solution. What happens is that normally, when titrating in the buffer range as shown here, the concentration of the acid increases while the concentration of the corresponding base decreases. This is what we under normal circumstances uses in the buffer equation:
| pH = pKa + log | [base] |
| [acid] |
where c(acid) = [acid] + [base].
But, since the solubility of the acid form is as low as it is, we soon reach the maximum concentration for the acid in the the buffer equation, after which the acid precipitates when formed and the concentrations of acid and base are no longer inversely proportional. The actual acid concentration, [acid], becomes a constant and the actual concentration of base, [base], decreases proportionally. The precipitation can be seen by the solution becoming milky and unclear. If the amount of insoluble acid is sufficiently high, you end up with a completely while slurry.
THEREFORE: For titrations be aware of secondary reactions, e.g. precipitations, phase separations, degassing and complex formations, that might affect the titration/titration curve!